400-691-9020
400-691-9020
发布时间:2018-12-14 关键词:新航道雅思写作
摘要:分享雅思考试小作文真题范文, 小作文数据题合集 The graph below shows three production in the forest industry in a European country. The production is timber, pulp and paper during the years from 1980 to 2000.
小作文数据题合集
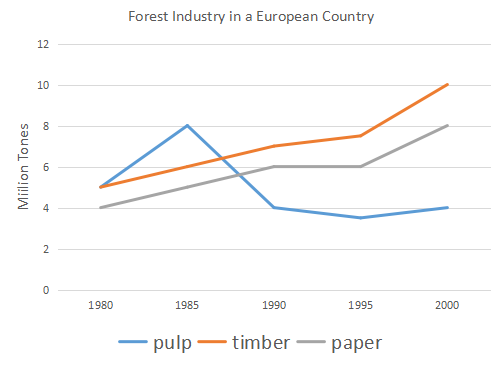
The graph below shows three production in the forest industry in a European country. The production is timber, pulp and paper during the years from 1980 to 2000.
信息加工:
timber和paper一直(总体)稳定上升;
pulp不稳定,1985年,1995年。
高分范文
黑色为学生习作;玫红色为教师批改;️后为段落经过批改后整理出来的样子。
The graph given illustrates the changing amounts of three different forest industry products of a European country’s forestry, namely pulp, timber and paper, produced in a western country from 1980 to 2000.
→The graph given illustrates the changing amounts of three different products of a European country’s forestry, namely pulp, timber and paper, from 1980 to 2000.【25 words】
First, there was an obvious continuous growth in the production of timber throughout the twenty years, and the figure in 2000【用“时间的所有格形式”更精简】2000’s production (10 million tonnes) was noticeably twice of that in of 1980 (5 million tonnes). Likewise, a similar 2-fold increase increasing pattern could be observed happened in the production of paper, despite the years from 1990 to 1995 witnessed that paper’s the production of paper kept steady in 6 million tonnes【句法的不合理:状语从句太长以及信息过剩,影响了主句信息的地位】a 5-year time of stability Furthermore, timber’s kept an advantage than over paper all the years.Meanwhile, paper was produced less than timber by 1-2 million tonnes constantly.
→First, there was an obvious continuous growth in the production of timber throughout the twenty years, and 2000’s production (10 million tonnes) was twice of that of 1980. Likewise, a 2-fold increase happened in the production of paper, despite a 5-year time of stability. Meanwhile, paper was produced less thantimber by 1-2 million tonnes constantly. 【54 words】
【最特殊的线最后写 /和多条线有交点的线最后写→pulp 最后写】
Among the three products, only pulp’s production of pulp fluctuated throughout the twenty years. Unlike timber and paper, pulp was produced in fluctuating amounts. ←总-分→ InThe year of 1985, which witnessed the maximum (8 million tonnes), was a dividing point at which the surge stopped and theplunge started【注意特殊/幅度大的“上升”、“下降”对应的词汇】. After the quick slip, the further decrease was significantly slower, and the year of 1995 witnessed the all-time/global【“有史以来的/给定时间短段内的/全局的”】minimum (3.5 million tonnes). During the subsequent years, the production climbed slowly to 4 million tonnes, as same as 1990’s level. pulp produced in this country achieved its peak at 8 million tones and bottom at 3.5 million tones respectively.In 2000, approximately 4 million tones pulp was made by the European country that had a higher production in both timber and paper.【没有写出“线性趋势”】
→ Unlike timber and paper, pulp was produced in fluctuating amounts. Theyear of 1985, which witnessed the maximum (8 million tonnes), was a dividing point at which the surge stopped and the plunge started. After the quick slip, the further decrease was significantly slower, and the year of 1995 witnessed the all-time/global minimum (3.5 million tonnes). During the subsequent years, the production climbed slowly to 4 million tonnes, as same as 1990’s level.【73words】
Overall, the tendency of the forest industry in the western European country was to produce more pulp, timber and paper → the similarity between the amounts of timber and paper produced was obvious, and so was the difference between them and the volume of pulp【宏观笼统总结线之间的关系】. 【24 words】
【充其量180 words左右一定能写完】
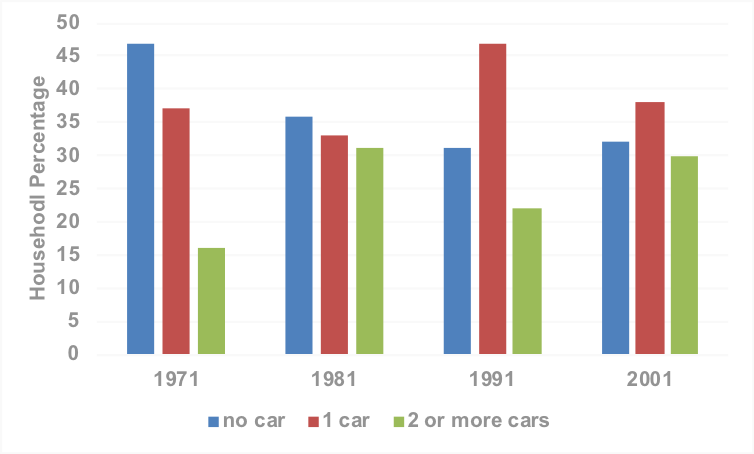
The chart shows the changes in the percentage of households with cars in a European country in four years.
信息加工【切勿当成“线性变化”】:
1. 绿色四个年份都最小(给个数值区间);蓝色、红色不相上下;
2. 蓝色在1971,在其它三个年份相互差不多;红色在1991年,在其它三个年份相互差不多;
3. 1971年和1991年三色差异明显(可算倍数关系)。
高分范文
The chart given demonstrates the car ownership among a European country’s households in 1971, 1981, 1991 and 2001.
First, in all of the four years, households that own two or more cars were the fewest,accounting for 16 percent to 31 percent. Meanwhile, one-car households were more than no-car households in 1991 and 2001, and the opposite was the case in 1981 and 1971. As a matter of fact, nearly half of the country’s households had no car in 1971 and one car in 1991, and there were similar lower percentages, between 30 percent and 40 percent, in the other years.
In addition, the years of 1971 and 1991 are noteworthy as the three types of households had immensely varying proportions in the two years and thedifference therebetween was as enormous as a few times.
Overall, among the four separate years, the country’s private car ownership increased in the three later years compared with the year of 1971.
【159 words】


400-691-9020


微信客服


 美国留学方案
 英国留学方案
 加拿大留学方案
 澳新留学方案
 英联邦留学方案
 单项服务
单项服务
 欧洲留学方案
 亚洲留学方案