400-660-2206
400-660-2206
当前位置:首页 雅思写作 2018年5月5日雅思小作文 Task 1线图参考范文
发布时间:2018-06-05 关键词:
摘要:直击考场 | 2018年5月5日雅思小作文 Task 1线图参考范文!
2018年5月5日雅思考试小作文题目
(国内A类):线图
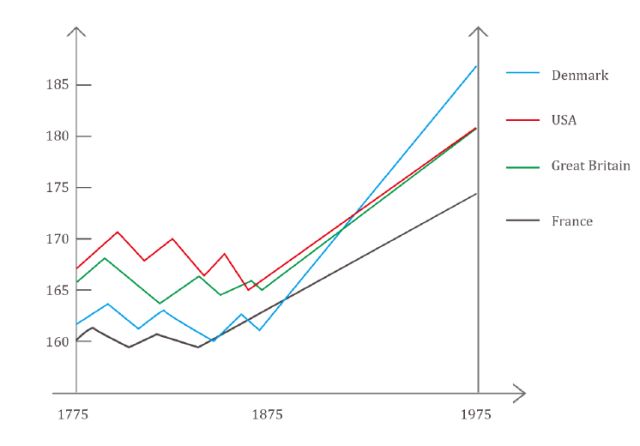
The graph shows the average height in different countries between 1775 and 1975.
Summarise the information by selecting and reporting the main features, and make comparisons where relevant.
雅思小作文范文:
The line graph compares the average height in four countries(Denmark, USA, Great Britain, France)over two centuries from 1775 to 1975. Generally, all the countries experienced an upward trend in their average heights.
At the beginning, Americans with average height were the tallest at about 167 cm followed by British (166cm) and Danes(162 cm), whereas Frenchmen were the shortest at around 160 cm.
Then, between 1775 and 1875, although there were fluctuations, the average heights had almost remained the same in four countries; however, the datum of Frenchmen surpassed that in Denmark in 1850.
After that, the figures regarding the USA and Britain kept at a similar height with an ongoing rising trend to the same height of 180cm in the year 1975. At the same time, Denmark had seen a sharp increase of the average height exceeding that of the other three countries before reaching the peak in 1975 at almost 190 cm, which is a remarkable contrast with the French whose figure was about 173 cm in the end.
新航道广州学校官网:https://gz.xhd.cn/
新航道广州学校咨询热线:020-85647182


400-660-2206


微信客服


 美国留学方案
 英国留学方案
 加拿大留学方案
 澳新留学方案
 英联邦留学方案
 单项服务
单项服务
 欧洲留学方案
 亚洲留学方案