发布时间:2020-07-09 关键词:
摘要:不少烤鸭反应雅思柱状图作文比较难,今天小编将针对这一问题,分享下雅思作文柱状图写作模板。用心看,掌握了柱状图作文的重点拿高分不在话下。
不少烤鸭反应雅思柱状图作文比较难,今天小编将针对这一问题,分享下雅思作文柱状图写作模板。用心看,掌握了柱状图作文的重点拿高分不在话下。
雅思作文柱状图写作模板汇总:
雅思柱状图作文模版一:
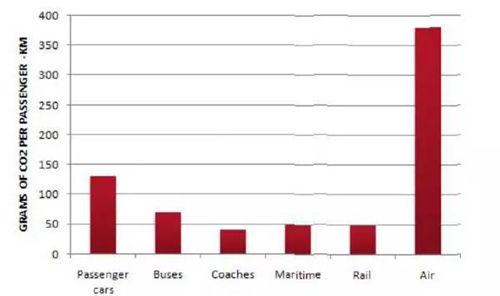
The table below shows CO2 emissions for different forms of transport in the European Union.
The pie chart shows the percentage of European Union funds being spent on different forms of transport.

The chart shows CO2 emissions per passenger kilometre for various methods of transport in the European Union while the pie chart shows European Union spending on transport. Flying by air produces by far the greatest CO2 emissions, approximately three times as much as passenger cars which are the next largest producers. Very little is spent by the EU on air travel while roads make up more than half of the EU transport budget.
Trains produce about three times less CO2 emissions per passenger kilometre than passenger cars and eight times less than air travel. Nearly a third of EU transport funds are spent on railways.
Ships are a clean form of transport and produce about the same amount of CO2 per passenger kilometres as trains do. However, only 2 percent of EU funds are spent on ports. A further one percent is spent on inland waterways.
Coaches are the cleanest form of transport. Emissions of CO2 per passenger kilometre from coaches are half those of buses. Buses emit less than half as much CO2 per passenger kilometre as cars. The European Union spends 10 percent of its transport budget on public transport, such as buses and coaches.
雅思柱状图作文模版二:
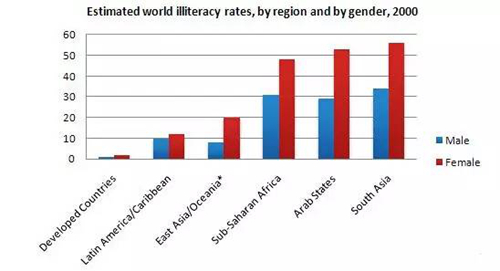
The chart below shows estimated world illiteracy rates by region and by gender for the year 2000.

The given bar chart shows the approximate world illiteracy rates by gender and region for the year 2000. As is observed in the given column graph, in all cased, the illiteracy rate among women is higher than men. Developed countries have almost ignorable illiteracy rate and in the contrary, about half of the population in south Asia, Arab states and Africa are illiterate.
The illiteracy rate in Latin America / Caribbean and East Asia / Oceania is only 1 percent (approximately), 10 percent and 14 percent (approximately) respectively considering both male and female. Sub-Saharan Africa, the Arab States and South Asia had rates of approximately 40%, 41% and 45%. Illiterate women are higher than the illiterate men in all the given countries.
In the developed countries, the proportion of literacy among men and female is almost similar but the differences increased for Asia, Arab states and Africa. Among the given 6 countries, South Asian population are far more illiterate than any other country.
以上是对雅思作文柱状图写作模板汇总的介绍,希望能帮助到大家。更多关于雅思考试的资讯与详情,可关注广州新航道雅思频道,或咨询广州新航道在线老师。
新航道广州学校官网:https://gz.xhd.cn/
新航道广州学校官方客服微信:gzxhdliang